I won a #FreePocketCHIP last Christmas. It is a "pocketable" Linux computer running Debian, and has one USB 2.0 host port. Apart from adding a speaker and playing PICO-8 games, PocketCHIP's form factor and hackability make it suitable for many other projects. Today, I'm going to find out how fast I am riding a bike, with the PocketC.H.I.P and VK-172 GPS receiver.

Meet the GPS Receiver
The GPS receiver I have is the VK-172 G-mouse USB GPS receiver (paid link).
It has a small form factor, and connects to the PocketCHIP via USB.
When connected, it identifies itself as a USB device with ID 1546:01a7, and shows up as a serial port:
chip@chip-c:~$ lsusb
Bus 002 Device 008: ID 1546:01a7 U-Blox AG
Bus 002 Device 001: ID 1d6b:0001 Linux Foundation 1.1 root hub
Bus 001 Device 001: ID 1d6b:0002 Linux Foundation 2.0 root hub
Bus 003 Device 001: ID 1d6b:0002 Linux Foundation 2.0 root hub
chip@chip-c:~$ ls -l /dev/ttyACM0
crw-rw---- 1 root dialout 166, 0 Jul 27 19:16 /dev/ttyACM0
After getting a serial port, almost all GPS receivers work the same: they will receive signals from the GPS satellites, compute the receiver's location and other parameters, and write the results in a text format, called "NMEA sentences", to the serial port.
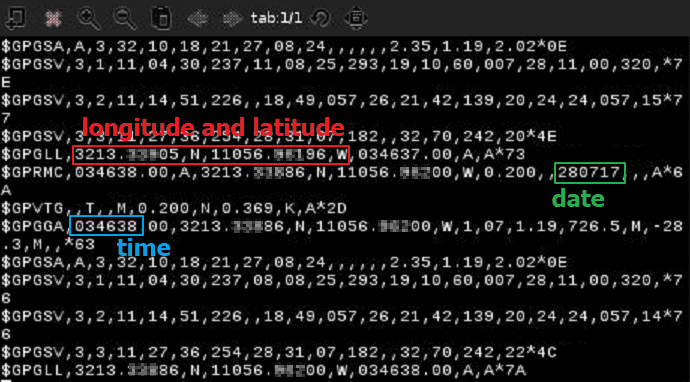
sudo screen /dev/ttyACM0 115200 command reads from the serial port, and gives me a scrolling window of NMEA sentences:

These NMEA sentences contain a variety of information received, computed, or inferred by the GPS receiver. I can easily identity longitude and latitude, date, and UTC time fields. However, semantics of other fields are less apparent without reading a specification.
Install gpsd and Clients
A better way to work with GPS receivers is through gpsd. gpsd is a service daemon that monitors GPS receivers attached to a computer, and make data on the location/course/velocity of the sensors available for queries. gpsd understands a wide variety of GPS receivers and protocols, so that I do not have to deal with all the complexity.
To install gpsd on PocketCHIP, execute:
sudo apt install gpsd gpsd-clients python-gpsThe gpsd-clients package installs a few "example" client programs that can display GPS data, such as xgps, which visualizes the information nicely:

However, my goal is to find out how fast I am riding a bike, and I can't be watching xgps interface while I am on the bike!
I need to log this information into a file for later analysis.
Flipping through all the client programs that came with gpsd, there are two programs that can write GPS data to a file: gpxlogger and gpspipe.
gpxlogger collects GPS data and prints the measurements in XML format, which works exactly like GPS Logger for Android.
Its output looks like:
<gpx version="1.1" creator="GPSD 3.11 - http://catb.org/gpsd"
        xmlns:xsi="http://www.w3.org/2001/XMLSchema-instance"
        xmlns="http://www.topografix.com/GPX/1/1"
        xsi:schemaLocation="http://www.topografix.com/GPX/1/1
        http://www.topografix.com/GPX/1/1/gpx.xsd">
 <metadata>
  <time>2017-07-28T04:09:55.000Z</time>
 </metadata>
 <trk>
  <src>GPSD 3.11</src>
  <trkseg>
   <trkpt lat="32.220033" lon="-110.940000">
    <ele>724.400000</ele>
    <time>2017-07-28T04:09:56.000Z</time>
    <src>GPSD tag=""</src>
    <fix>3d</fix>
   </trkpt>
   <trkpt lat="32.220035" lon="-110.940001">
    <ele>725.000000</ele>
    <time>2017-07-28T04:09:57.000Z</time>
    <src>GPSD tag=""</src>
    <fix>3d</fix>
   </trkpt>
   <trkpt lat="32.220042" lon="-110.940002">
    <ele>725.600000</ele>
    <time>2017-07-28T04:09:58.000Z</time>
    <src>GPSD tag=""</src>
    <fix>3d</fix>
   </trkpt>
  </trkseg>
 </trk>
</gpx>
Unfortunately, this output does not contain the speed.
gpspipe uses a JSON output format, providing richer information.
gpspipe -w output looks like (the actual output is line-based where every line is a complete JSON object; snippet has been re-formatted):
{"class":"VERSION","release":"3.11","rev":"3.11-3","proto_major":3,"proto_minor":9}

{"class":"DEVICES","devices":[{"class":"DEVICE","path":"/dev/ttyACM0","driver":"u-blox",
 "subtype":"1.00 (59842)","activated":"2017-07-28T04:12:05.076Z","flags":1,"native":0,
 "bps":115200,"parity":"N","stopbits":1,"cycle":1.00,"mincycle":0.25}]}

{"class":"WATCH","enable":true,"json":true,"nmea":false,"raw":0,"scaled":false,
 "timing":false,"split24":false,"pps":false}

{"class":"SKY","tag":"GSV","device":"/dev/ttyACM0",
 "xdop":0.76,"ydop":0.76,"vdop":1.56,"tdop":1.15,"hdop":1.08,"gdop":2.39,"pdop":1.90,
 "satellites":[{"PRN":4,"el":22,"az":228,"ss":20,"used":false},
               {"PRN":8,"el":25,"az":281,"ss":26,"used":true},
               {"PRN":10,"el":59,"az":30,"ss":17,"used":true},
               {"PRN":11,"el":9,"az":318,"ss":21,"used":false},
               {"PRN":14,"el":61,"az":241,"ss":18,"used":true},
               {"PRN":18,"el":43,"az":71,"ss":26,"used":true},
               {"PRN":21,"el":31,"az":145,"ss":22,"used":true},
               {"PRN":24,"el":18,"az":48,"ss":21,"used":true},
               {"PRN":27,"el":29,"az":241,"ss":28,"used":true},
               {"PRN":31,"el":17,"az":178,"ss":0,"used":false},
               {"PRN":32,"el":77,"az":281,"ss":18,"used":true}]}

{"class":"TPV","tag":"GLL","device":"/dev/ttyACM0","mode":3,"time":"2017-07-28T04:12:06.000Z",
 "ept":0.005,"lat":32.220067000,"lon":-110.940033333,"alt":736.700,
 "epx":11.361,"epy":11.395,"epv":35.880,"track":0.0000,"speed":0.366,"climb":0.000,"eps":22.79}

{"class":"SKY","tag":"GSV","device":"/dev/ttyACM0",
 "xdop":0.76,"ydop":0.76,"vdop":1.56,"tdop":1.15,"hdop":1.08,"gdop":2.39,"pdop":1.90,
 "satellites":[{"PRN":4,"el":22,"az":228,"ss":20,"used":false},
               {"PRN":8,"el":25,"az":281,"ss":26,"used":true},
               {"PRN":10,"el":59,"az":30,"ss":17,"used":true},
               {"PRN":11,"el":9,"az":318,"ss":22,"used":false},
               {"PRN":14,"el":61,"az":241,"ss":18,"used":true},
               {"PRN":18,"el":43,"az":71,"ss":26,"used":true},
               {"PRN":21,"el":30,"az":146,"ss":22,"used":true},
               {"PRN":24,"el":18,"az":48,"ss":21,"used":true},
               {"PRN":27,"el":29,"az":241,"ss":28,"used":true},
               {"PRN":31,"el":17,"az":178,"ss":0,"used":false},
               {"PRN":32,"el":77,"az":281,"ss":18,"used":true}]}

{"class":"TPV","tag":"GLL","device":"/dev/ttyACM0","mode":3,"time":"2017-07-28T04:12:07.000Z",
 "ept":0.005,"lat":32.220065833,"lon":-110.940031833,"alt":735.500,
 "epx":11.361,"epy":11.395,"epv":35.880,"track":0.0000,"speed":0.115,"climb":0.000,"eps":22.79}
In this output, I can find my speed in "class":"TPV" records under "speed" property.
Go for a Bike Ride
A GPS receiver must have good reception of satellite signals to work correctly and accurately. If the skyview were obscured, the GPS receiver would complain "no fix" and does not produce any meaningful readings. Thus, it is critical to keep the GPS receiver exposed.

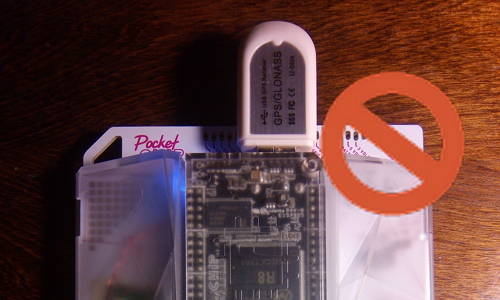
My test indicates that plugging the GPS receiver directly on PocketCHIP's USB port causes bad reception. Most likely, the big printed circuit board is blocking satellite signals. Thus, a USB extension cord is necessary for optimal GPS reception performance.

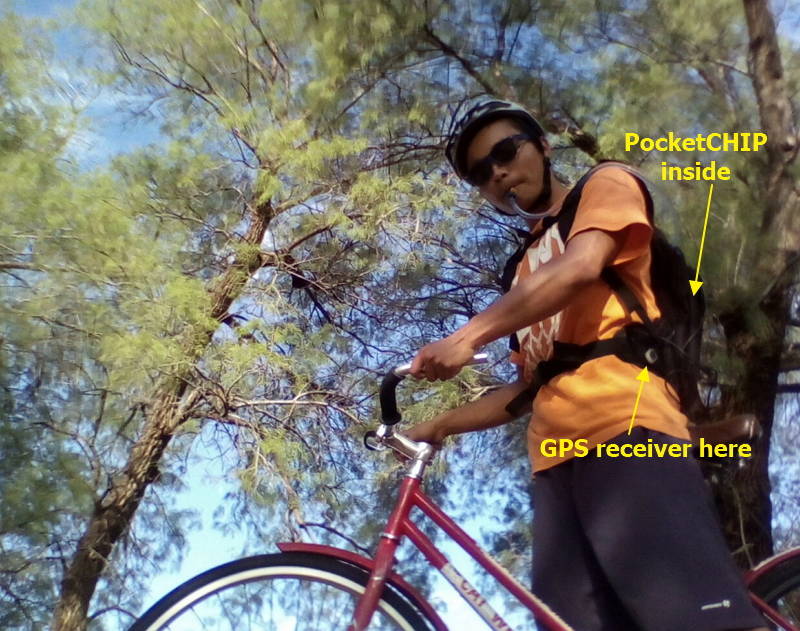
I place the GPS receiver in a small pocket on the outside of my backpack (paid link), connected via an USB extension cord to the PocketCHIP located in a larger compartment of the backpack.
When I'm ready to ride, I open the console and type gpspipe -w | tee gps.log, to collect GPS data into a file.
While gpspipe is running, I turn off the screen by selecting Sleep option in PocketHome, so that the battery can last longer.
At the end of my ride, I go back into the console, and press CTRL+C to end GPS data collection.
Regarding battery consumption: with PocketCHIP screen in sleep mode and VK-172 GPS receiver running, a 3-hour bike ride recording session consumes 30~35% from a fully charged battery. Thus, I estimate the PocketCHIP battery can last about 7 hours for this application.
Find Top Speed through Data Analysis
Although gpspipe -w writes JSON output, every record is on a separate line, so it's easy enough to parse the log with awk.
#!/usr/bin/awk -f
BEGIN {
  FS = ","
}
$0 ~ /"class":"TPV"/ && $0 ~ /"tag":"GLL"/ && $0 ~ /"mode":3/ {
  for (i = 1; i <= NF; ++i) {
    if ($i ~ /"speed":/) {
      print substr($i, 9, 9999)
    }
  }
}
This script parses gps.log and prints all speed records.
Speed unit is meters per second (m/s).
To obtain my top speed, I can simply run:
chip@chip-c:~$ ./gps.awk gps.log | sort -n | tail -1
9.641
So here's the answer! I am riding the bike at a top speed of 9.641 m/s, or 21.56 mph.
Plot Speed Over Time
I can visualize how my riding speed changes over time with Gnuplot.
After installing Gnuplot sudo apt install gnuplot, I can plot the speeds with:
chip@chip-c:~$ ./gps.awk gps.log > speed.txt
chip@chip-c:~$ gnuplot

  G N U P L O T
  Version 4.6 patchlevel 6    last modified September 2014
  Build System: Linux armv7l

  Copyright (C) 1986-1993, 1998, 2004, 2007-2014
  Thomas Williams, Colin Kelley and many others

  gnuplot home:     http://www.gnuplot.info
  faq, bugs, etc:   type "help FAQ"
  immediate help:   type "help"  (plot window: hit 'h')

Terminal type set to 'qt'
gnuplot> plot 'speed.txt' with lines notitle
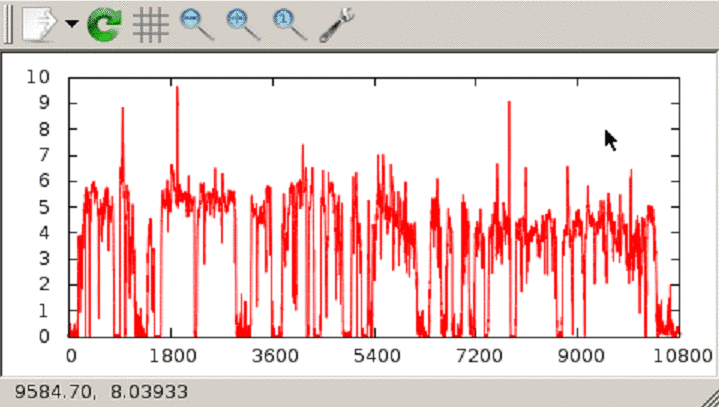
The chart appears: (press Q to close the chart)

I can see that my riding speed starts at more than 5 m/s, but it drops to 4 m/s when I'm into the third hour and my sore legs aren't helping.
Conclusion
This post demonstrates how to use a PocketC.H.I.P and a VK-172 USB GPS receiver to record an activity such as a bike ride using gpsd and gpspipe programs, and then find out the maximum moving speed during the activity, as well as create a chart of speed over time using gnuplot program.