Losant is a simple and powerful IoT cloud platform. Sensor devices, such as the Losant Builder Kit, can connect to their MQTT broker over the public Internet, and report state in real time. Based on those state reports, the software running in the cloud (call "workflows") can take actions such as sending an alert over email or text message, or deliver a command to be executed on an actuator device over MQTT.
One important question to ask is: how stable is this system? There are many elements in this system that can fail:
- Losant MQTT broker
- workflows in the cloud
- connected device (sensor or actuator)
- power supply to the connected device
- the Internet connection
Hopefully, the good folks at Losant has deployed enough redundancy for their MQTT broker and machines to execute workflows, and the user is careful enough when modifying the workflows. A failure is more likely to occur in the connected device, its power supply, or Internet connection. Failure in any of these three elements will result in the device being disconnected from the Losant MQTT broker. Thus, we can find out how stable the system is from the cloud end: monitor MQTT connection from a workflow.
Brent Crawford has designed a workflow to alert the owner when a device has been offline for more than 10 minutes. While it's useful for a device deployed in the field, it's unnecessary for me to receive alerts because my device is right across the room and I can just glance at an LED that indicates its connectivity. I'm more interested in the history of device uptime.
My solution consists of three parts:
- a virtual device to store device connectivity
- a workflow to collect device connectivity over time
- a dashboard block to visualize device uptime history
The virtual device just needs an isConnected attribute with Number type.
When the device is UP, the workflow reports value 1.
When the device is DOWN, the workflow reports value 0.
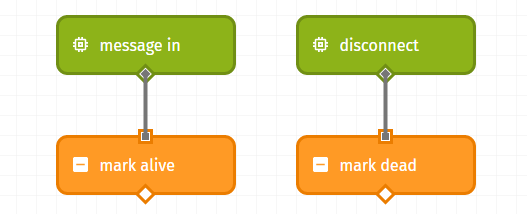
The workflow looks like:

- "message in" is a Device trigger node which gets triggered whenever a state report is received from the device.
- "mark alive" is a Virtual Device output node that reports
isConnected=1to the virtual device. - "disconnect" is an On Disconnect trigger node which gets triggered whenever the MQTT broker loses connection from the device.
- "mark dead" is a Virtual Device output node that reports
isConnected=0to the virtual device.
I have chosen "message in" as the criteria of marking the device as UP, as it's more suitable for a sensor device. If the device is actuator-only that does not report states periodically, it's better to On Connect trigger node.
During testing, I have found that On Disconnect trigger node gets triggered not only when a device's connection is lost, but also when a device attempts to reconnect when the previous connection has not timed out.
In the latter case, the new connection might be successful, but On Connect and On Disconnect can occur in either order.
Thus, if On Connect trigger node is used in place of "message in", it would be necessary to add a Conditional logic node under "disconnect" with expression {{data.disconnectReason}} == 'Connection Lost'.
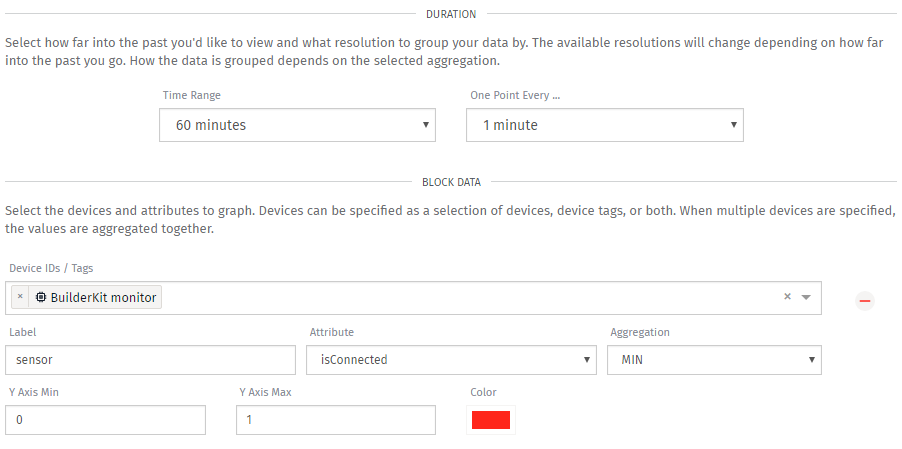
Finally, a time series graph on the virtual device's isConnected is created as the dashboard block.

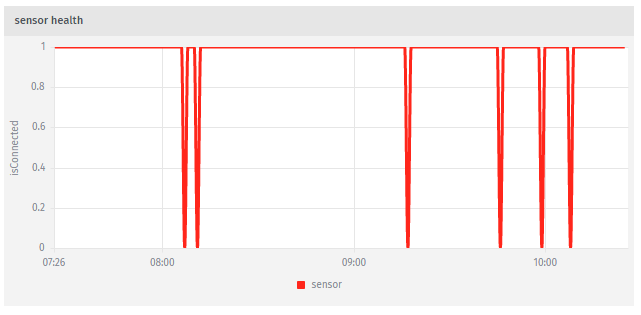
The result looks like this:

This gives me a visual sense about how stable my system is. An added bonus is, unlike a Device Connection Log dashboard block, this graph can be embedded in a public dashboard. If you are confident with your connected device and your WiFi, show it to the world!